

SERIES: Measurement That Matters
MINI CASE STUDY
Using Data to Evolve a Campus-Wide ESL Program
Actionable Insights
Don’t limit your use of collected data to an after-the-fact judgement call on how well something went. Use it as an ongoing decision-making tool.
Year 2018-2020
Industry Higher Education
Audience ESL University Students
Components infographic (Word, Excel)
Theme(s) data-based decision making
Challenge
I led the launch of a new university-wide ESL support service at McMaster. We had a two-year funding window, and to ensure continued support, we needed to regular report on our progress
See the related full case study: Piloting a University-Wide ESL Program
Approach
I created a feedback form that each student filled out every time they attended a workshop or used a service. After each semester, I summarized that data along with data gathered on:
- How often each workshop was offered
- Attendance by workshop, series, and category
- Average attendance per student
- Participation by faculty and student level
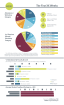
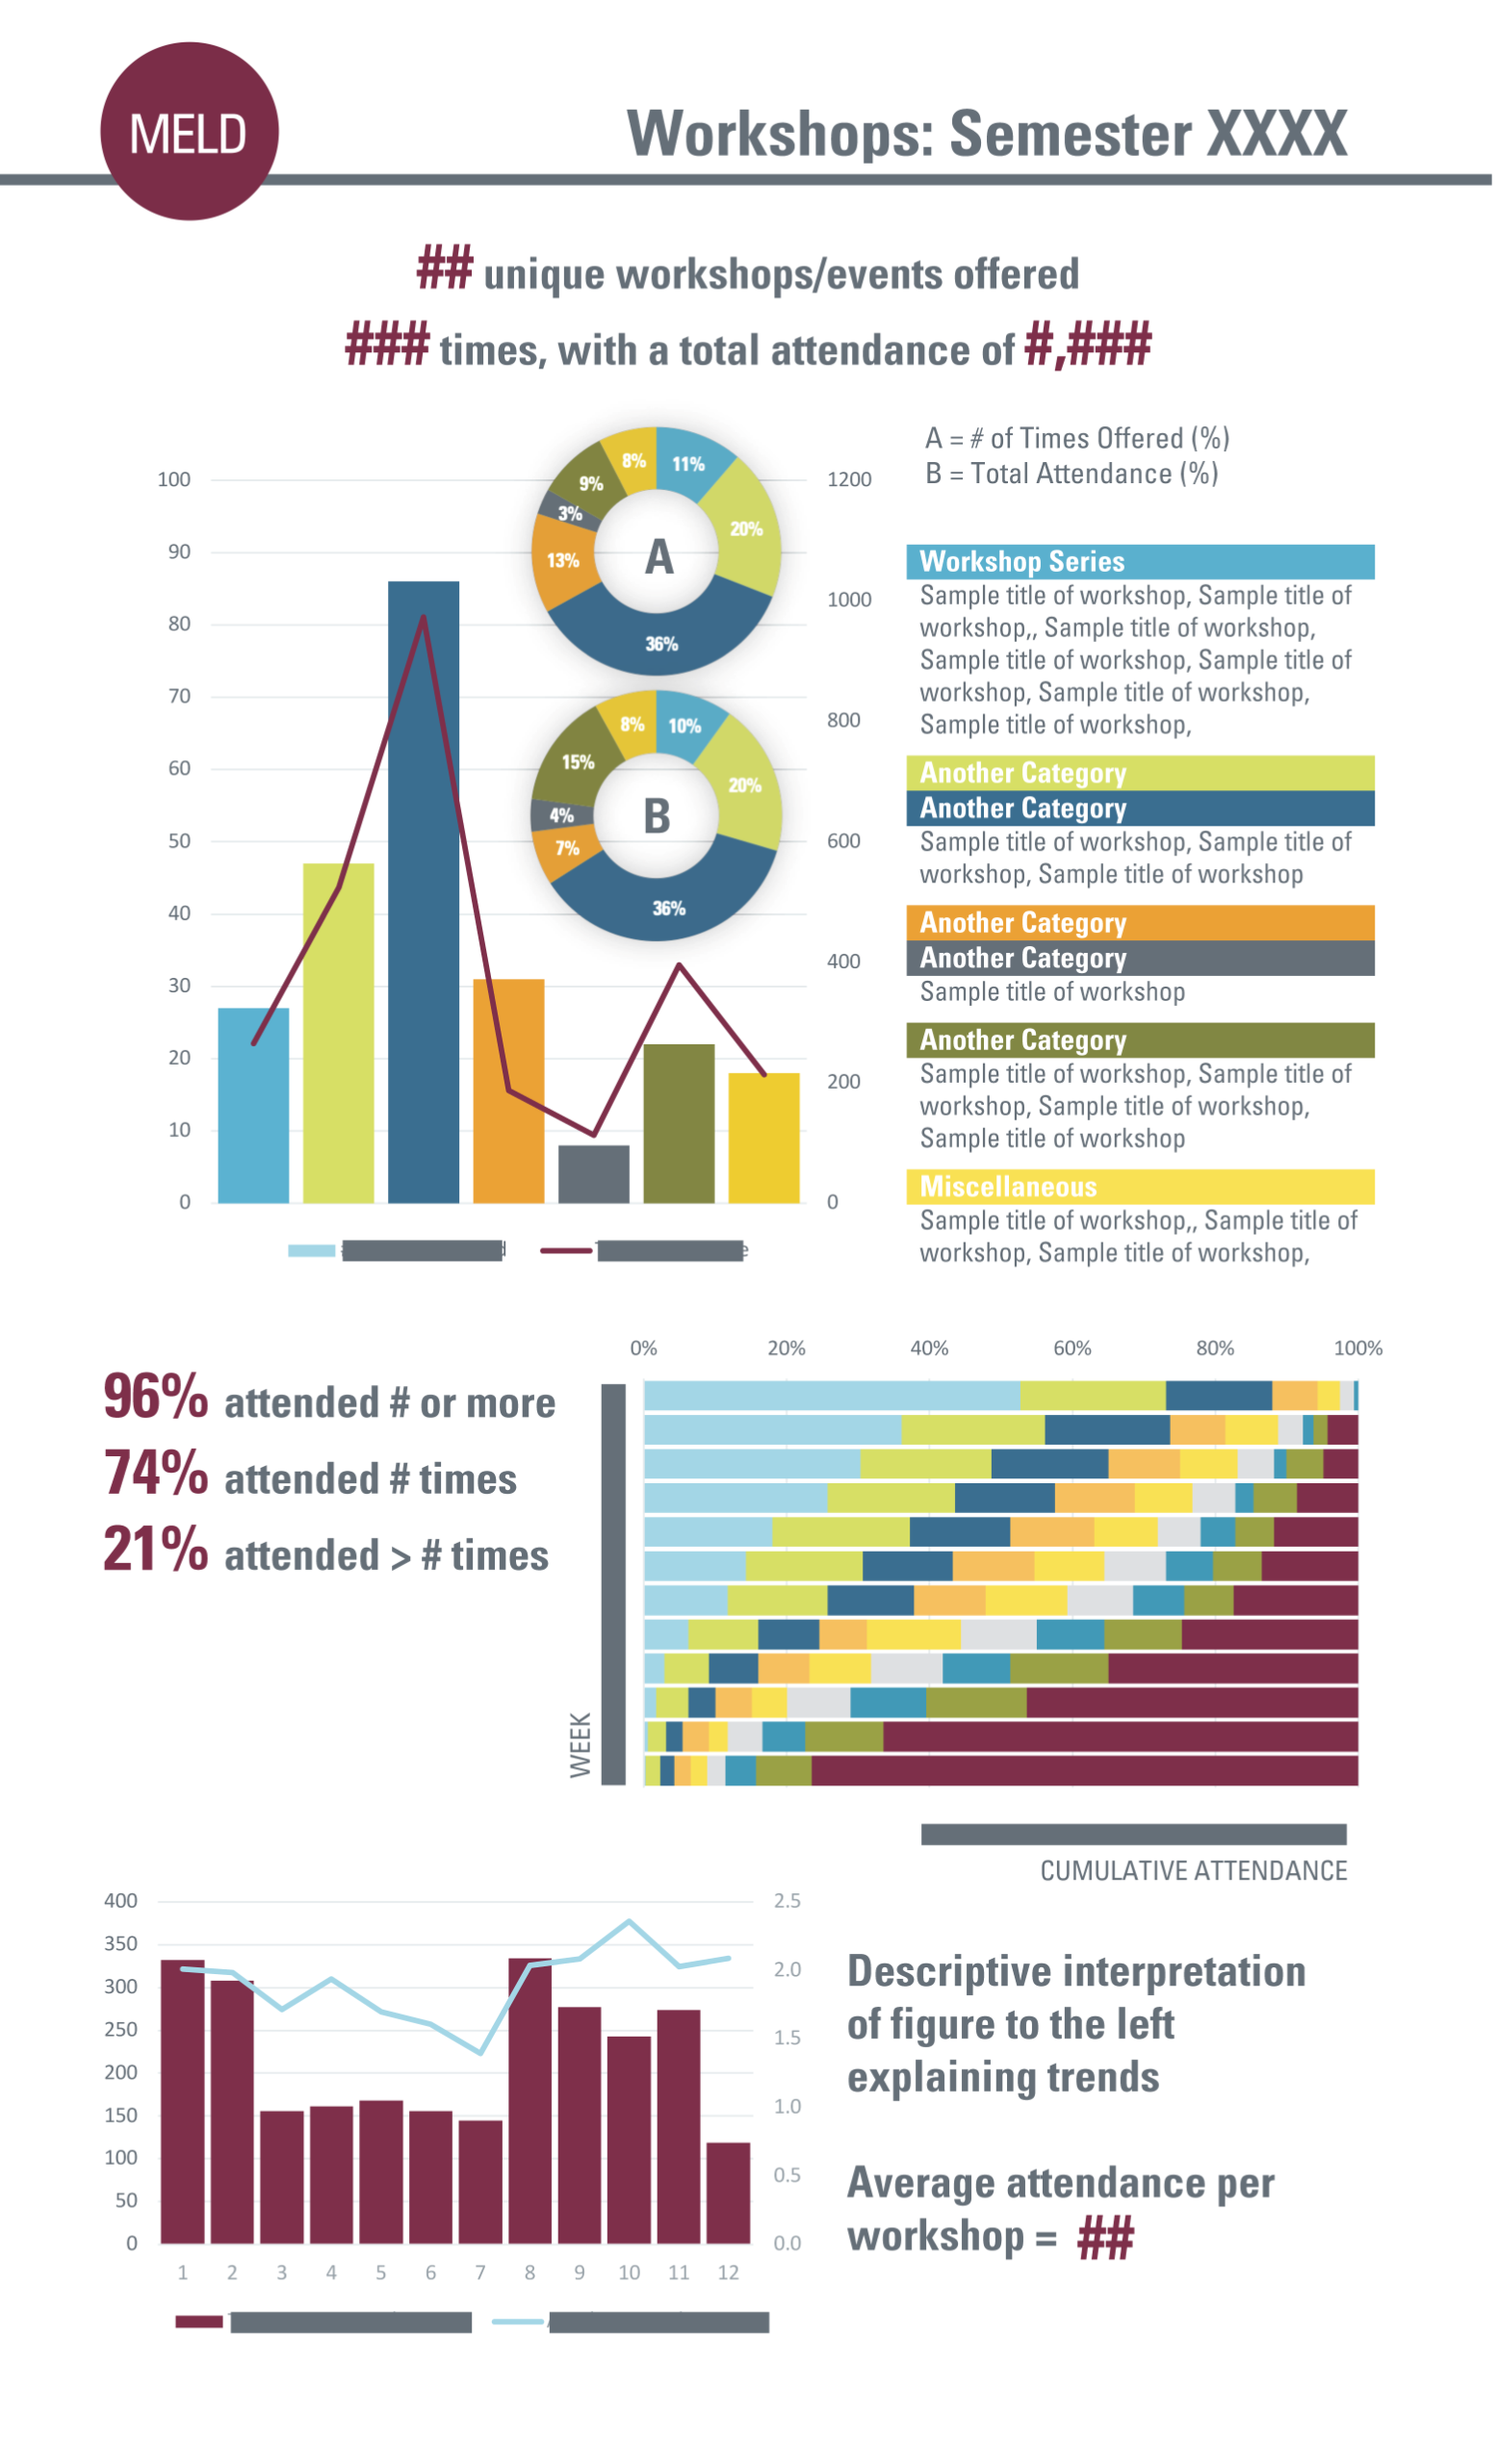
CAPTION: These are infographics I created to share results with stakeholder. The first is for the campus-wide program launch; the second is for a closely related bridging program for ESL students who did not meet the university’s language proficiency standards. I have removed the actual category titles and numbers for privacy.
Results
We used this data to petition for a more central location. After the move, both attendance and demographic diversity increased significantly. I also used insights to fine-tune which workshops we offered and when, helping us serve students more effectively and make the case for long-term funding.
I am text block. Click edit button to change this text. Lorem ipsum dolor sit amet, consectetur adipiscing elit. Ut elit tellus, luctus nec ullamcorper mattis, pulvinar dapibus leo.
MINI CASE STUDY
Piloting Scenario-Based Assessments to Build Client Confidence
Actionable Insights
An assessment is only too difficult if it is testing for knowledge or skills you wouldn’t expect learners to have after completing the training. If it is testing for the right things, but scores are low, making it “easier” is unlikely to be the right solution. Instead, use data to pinpoint the real issues.
Year 2024
Industry Financial
Audience Sales Professionals
Components 130+ scenario-based multiple-choice questions
Theme(s) calibrating assessment difficulty
Challenge
For a high-profile training program, I wrote scenario-based assessments that measured application of knowledge, not just recall.
The SMEs reviewing the assessments were worried that the questions were too difficult. There was a company determined pass-rate that had to be achieved.
Approach
To build confidence, I recommended a data-driven pilot.
We gave the assessments to SMEs uninvolved in course creation, and I conducted an item analysis on their answers to review how questions performed.
Some questions the client thought might be too difficult were consistently answered correctly. A few were consistently answered incorrectly. And some were answered differently by all testers.
This information helped us identify which questions were ambiguous or misaligned and which simply needed clearer phrasing.
CAPTION: A fictionalized example of our data showing the types of patterns we encountered. (e.g. Q2 likely needs to be rewritten. Why do our SMEs think Q3 D is correct? Did SME 2 and SME 3 have the requisite knowledge? Was Q9 not displayed correctly?)
Results
We revised unclear questions, verified correct options, and clarified instructions.
In the end, the client was satisfied with the changes and agreed to keep the assessment at the original difficulty level. The data gave them the confidence that what they had was both challenging and defensible.